Charts for the MGS competition
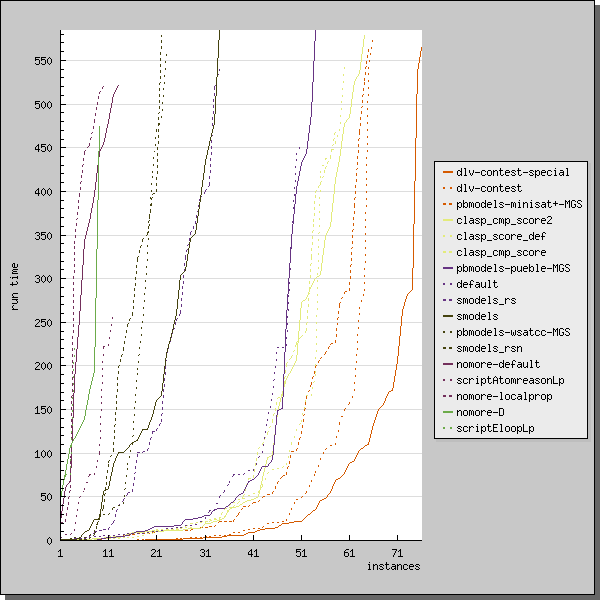
Run time comparison of all call scripts: Runtime in seconds plotted against the number of solved instances.
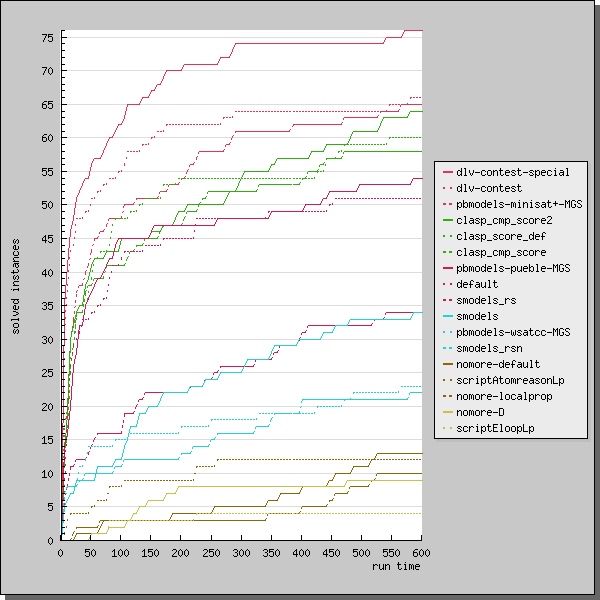
Run time comparison of all call scripts: Number of solved instances plotted against runtime (in seconds).
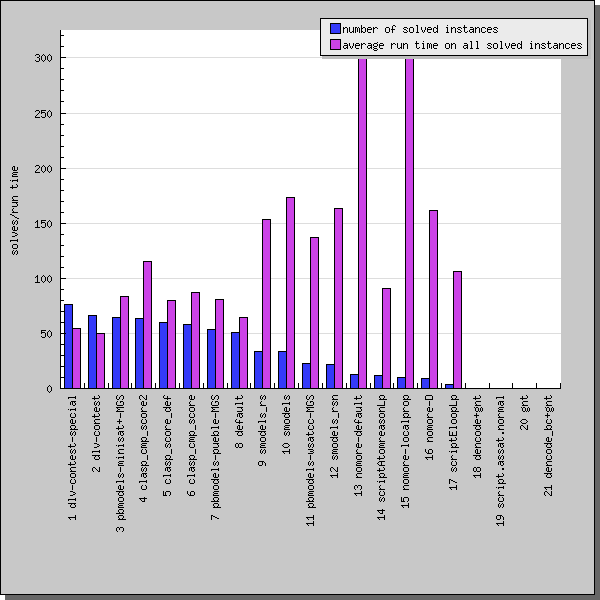
Number of solved instances and average run time (excluding timeouts) for all call scripts:
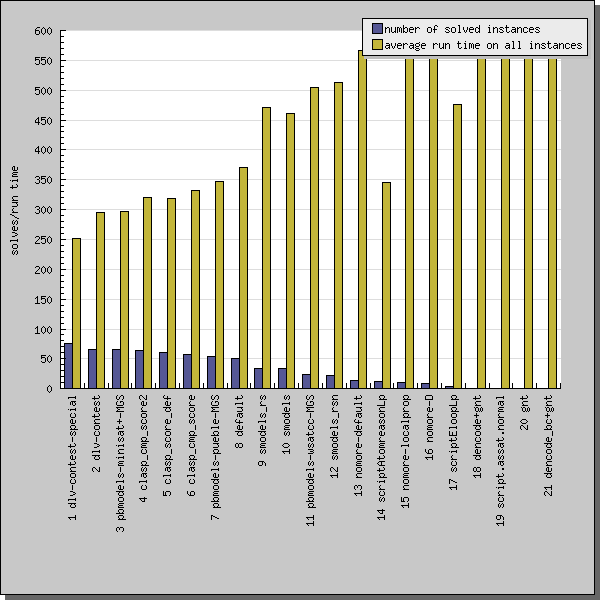
Number of solved instances and average run time (timeouts are taken as solved in 600 seconds) for all call scripts: